

Overview
In this tutorial, we will be using an instance of Prometheus running on a Linux VM to scrape metrics from PlanetScale and then forward them to New Relic using Remote Write. We will make sure that Prometheus stays running by creating a Systemd Unit File. The default configuration we will create will send all PlanetScale metrics to New Relic, and we will cover how to filter to drop certain metrics that may not be desired. In order to proceed, you’ll need:- A New Relic API Key, make sure it is the
Ingest - Licensetype. - PlanetScale Service token with
read_metrics_endpointspermissions.
Prometheus Installation
First, let’s download the latest release of Prometheus and create our user that is going to run it. We’ll be using the latest 3.x release from the GitHub Releases Page. Create aprometheus user:
/opt/prometheus along with the example configuration file that we can use.
Create our Systemd Unit File
Now that we have the binary in place, let’s setup Systemd to run Prometheus by creating a Unit File in/etc/systemd/system/prometheus.service with the following contents:
Configure Prometheus
Now that we’ve got Prometheus installed and a unit file present, let’s configure Prometheus. We will be borrowing some of our configuration from the Prometheus Guide, and adding some New Relic specific configuration. Edit/opt/prometheus/prometheus.yml in your editor of choice so that it contains this, making sure to replace your org name, service token information, and New Relic API key:
- Configures Prometheus to discover scraping endpoints from the PlanetScale API using a service token
- Points Prometheus to write the metrics it scrapes from PlanetScale to the New Relic API
Starting Prometheus
Now that we have a Systemd unit file and a configured Prometheus, let’s run it!active (running), and I can see the logs showing that it started successfully. Great!
Querying on New Relic
After a couple of minutes, head over to your New Relic dashboard and we can query for your database metrics. First, let’s get a list of the database branches in thenick organization that I’m using to test:
7wxuxewx4l0p branch.
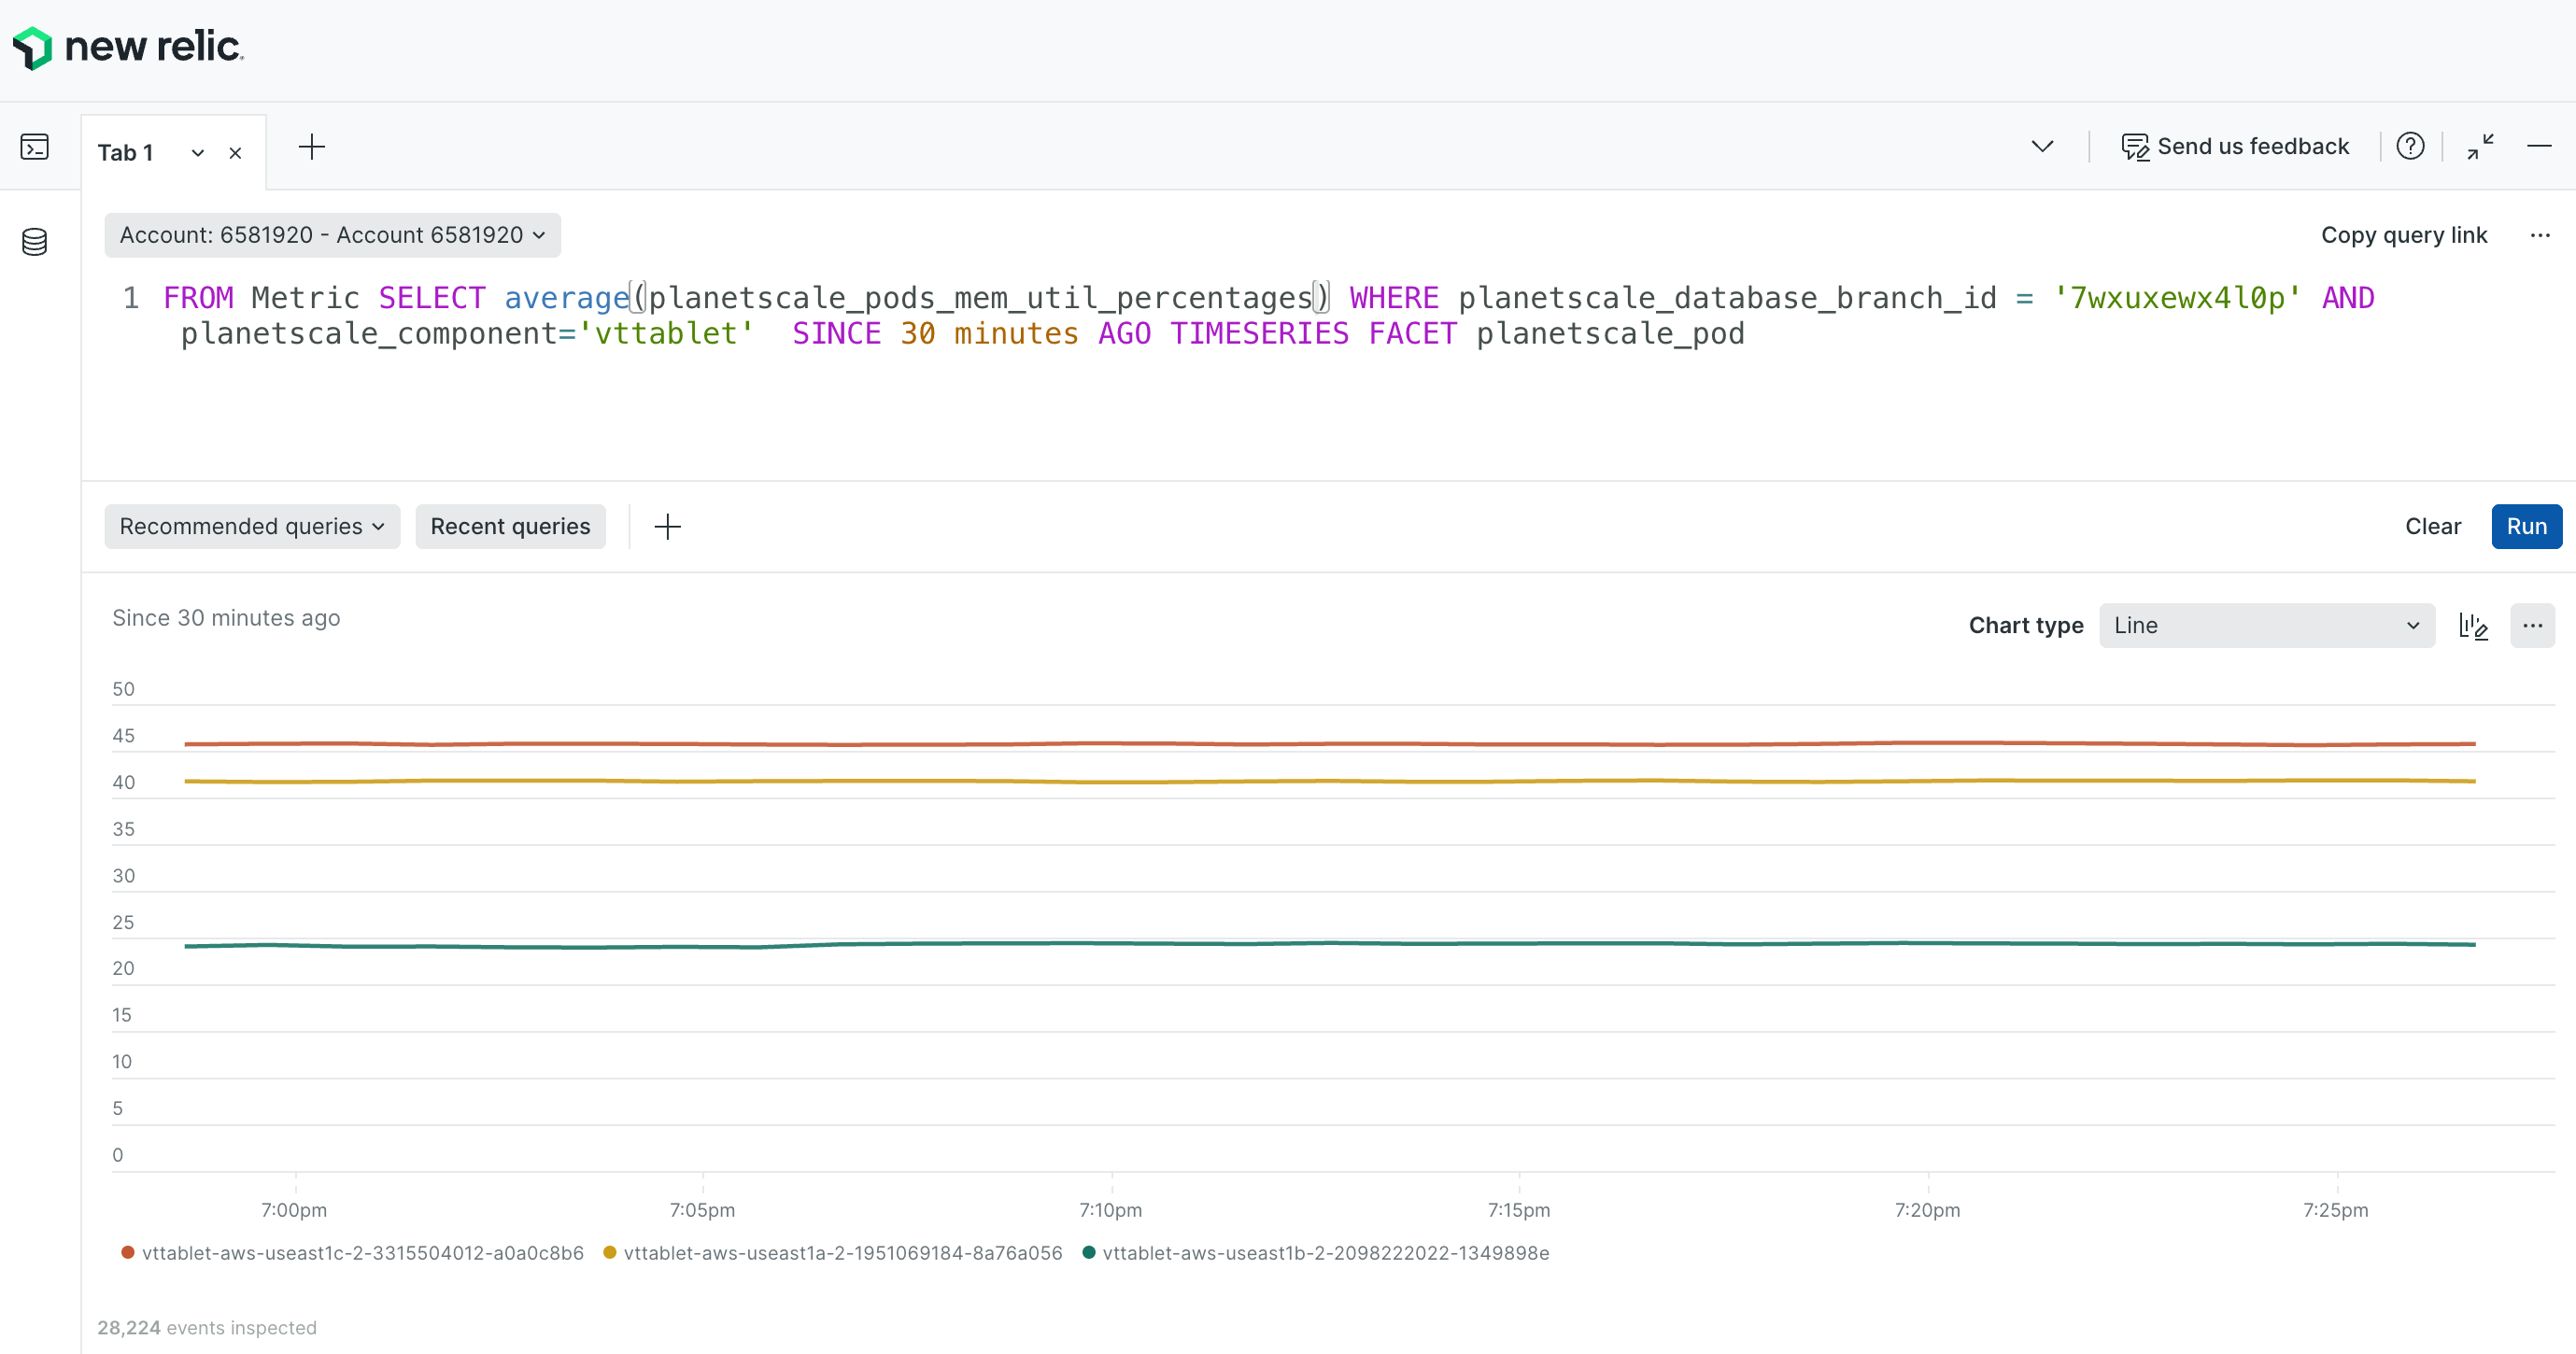
Using New Relic’s NRQL, we can visualize the memory usage of my VTTablet instances with the following query:
main branch is production, we will see the memory usage for my primary and both my replicas over the last 30 minutes:
Filtering Metrics
If you don’t want to ingest every metric into New Relic, you can tell Prometheus to drop certain metrics. For more information, see the New Relic Documentation. If we adjust our Prometheus configuration that we have in/opt/prometheus/prometheus.yml we can instruct Prometheus to drop all metrics unless they match a certain naming convention:
remote_write block with what’s above, Prometheus will only forward the timeseries that match the planetscale_pods_* name. For a full list of metrics, see our Metric List.