

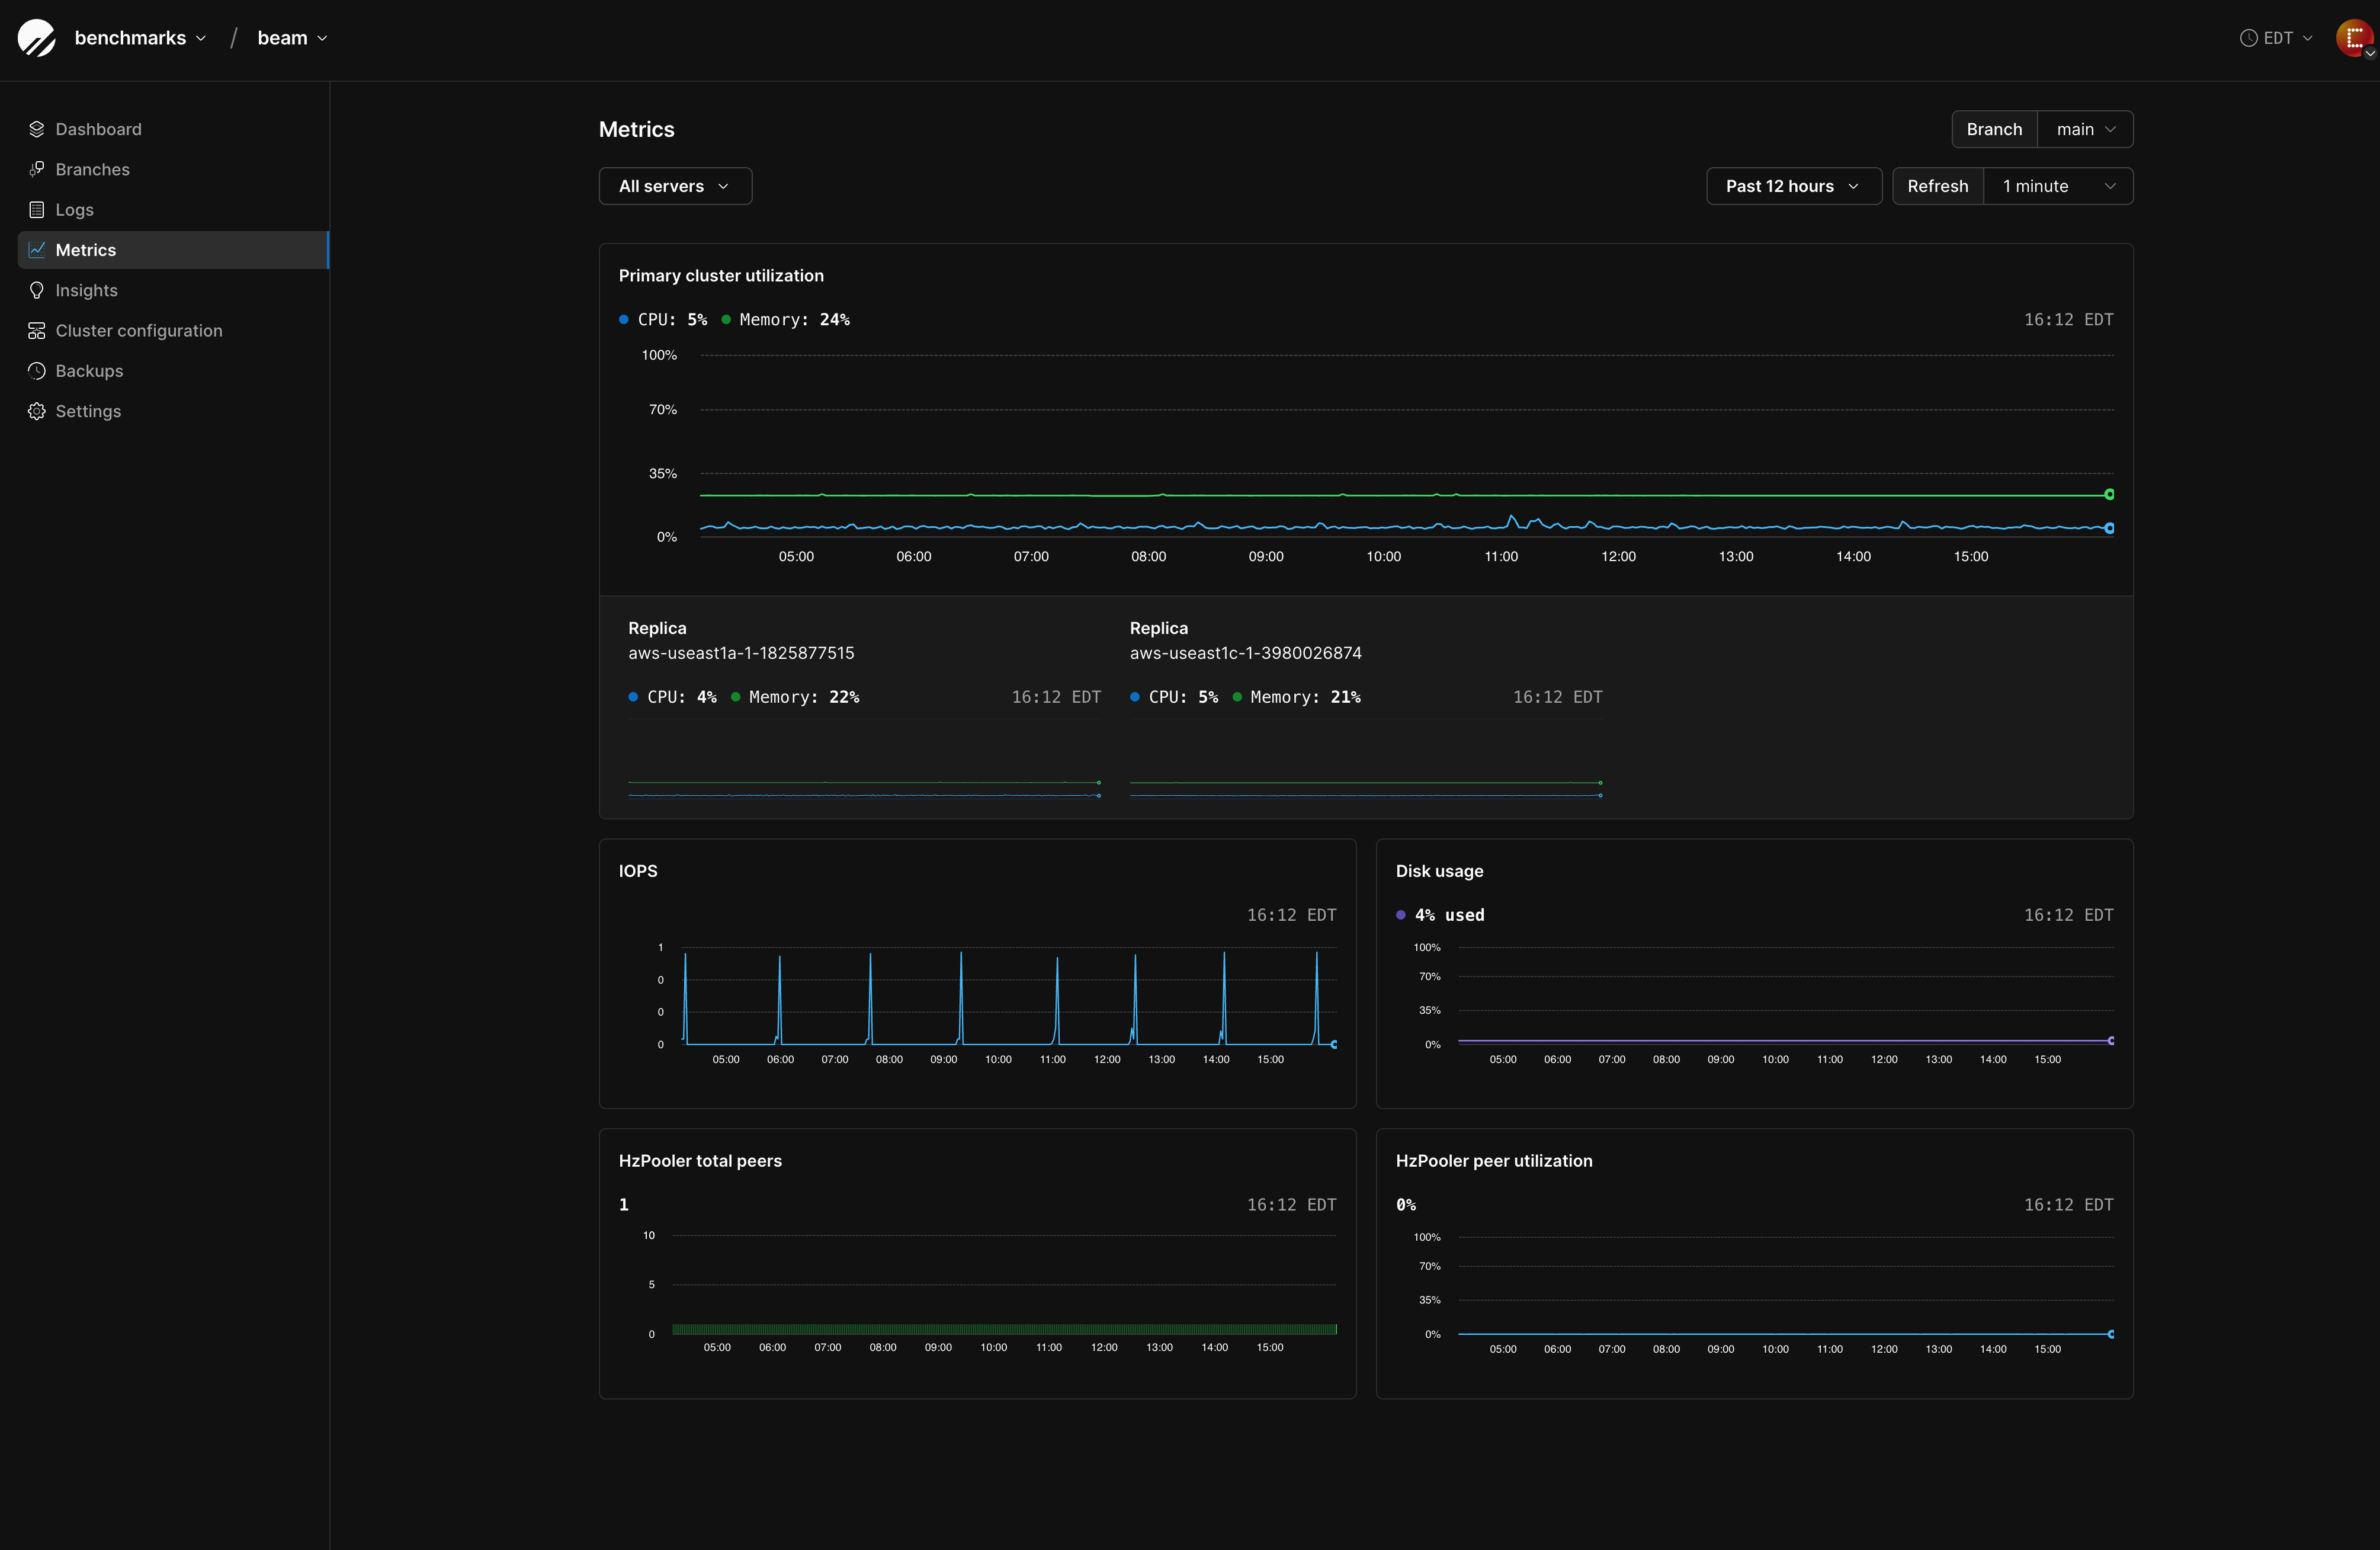
Dashboard overview
The Metrics dashboard displays real-time and historical data about your database cluster’s performance across multiple dimensions. You can filter metrics by:- Server Filter: Monitor all servers or focus on specific instances
- Branch: Select which database branch to monitor
- Time Range: View data from the past 15 minutes up to custom time ranges
- Live update: Toggle on/off the auto-refresh of data every ~30 seconds
Key metrics categories
Primary cluster utilization
The primary cluster utilization panel shows your primary database server’s resource consumption:Replica monitoring
Each replica displays individual performance metrics in dedicated panels:Primary IOPS
Primary storage usage
Storage metrics vary depending on your cluster’s storage type: For Network-attached Storage clusters:
For PlanetScale Metal clusters:
Storage metric differences: Network-attached storage clusters show absolute storage usage (MB/GB), while PlanetScale Metal clusters display disk usage as a percentage since storage scaling requires changing the entire instance size.
Memory
Transaction rate
Postgres connections
PgBouncer connections
PgBouncer peer utilization
PgBouncer server pools
PgBouncer client pools
The client connection ceiling shown for a dedicated pool is the total across all of its PgBouncers, not the
max_client_conn value alone, because a dedicated pool runs multiple PgBouncers spread across availability zones (configured with “PgBouncers per availability zone”). See Configuring PgBouncers.WAL archival rate
WAL archive age
WAL storage
Replication lag
Interpreting metrics
Normal operating ranges
- CPU: 0-30% for typical workloads
- Memory: 20-80% depending on dataset size
- IOPS: Varies by workload type (OLTP vs. analytics)
- Storage Usage: Keep below 80% for optimal performance (applies to both absolute storage usage and disk usage percentage)
Performance indicators
- Consistent Low CPU/Memory: Indicates healthy, optimized queries
- Spiky IOPS: May indicate batch processing or analytical workloads
- Low Connection Pool Utilization: Suggests efficient connection management
- High Active Cache vs Inactive Cache: Indicates good data locality and efficient query patterns
- Low Transaction Rate: May indicate application bottlenecks or connection pooling issues
- High Idle in Transaction: Suggests application issues with transaction management
Troubleshooting with metrics
- High CPU: Check for inefficient queries or missing indexes
- High Memory: Monitor for high memory usage from large queries or buffer cache pressure
- High IOPS: Analyze query patterns and consider query optimization
- High Storage/Disk Usage: Plan for storage scaling or data archiving (for Metal clusters, this requires instance resizing)
- High RSS vs Memory Mapped: May indicate memory pressure or suboptimal shared_buffers configuration
- Low Transaction Rate: Investigate connection pooling, application logic, or database locks
- High Idle in Transaction: Review application transaction handling and connection management
- Imbalanced Cache (Active/Inactive): Consider adjusting memory settings or query optimization
WAL monitoring best practices
- Archive age: Should typically be under 60 seconds for healthy systems
- Archival success rate: Aim for 100% success rate with zero failures
- WAL storage: Monitor for steady-state usage with periodic cleanup cycles
- Replication lag: High lag may indicate WAL transmission issues
Best practices
- Baseline Establishment: Understand your normal operating ranges
- Alert Thresholds: Set up monitoring alerts for critical thresholds
- Trend Analysis: Use historical data to predict scaling needs
- Performance Correlation: Cross-reference metrics with application performance